List of Frontend Debug Tools
- Crome DevTools
- Mozilla Firefox DevTools
- Safari Inspector
- Angular Augury
- Webstrom by JET Brain
- NoteJS Inspector
- JS Bin
1. Crome DevTools
This is in browser tool most popular and used by frontend developer.
Features
- Debugger: If you are working with a large codebase, this will help you access specific line-views. Developers simply need to drop a debugger; statement in the area that they need to inspect.
- Blackbox Script: Helps to BlackBox the vendor code so that the debugger does not jump out of the code, saving crucial debugging time.
- DOM Breakpoints: Isolates a DOM element so that when breakpoints are triggered, the tool highlights the code that’s changing the DOM in the source panel.
- Event Listener Breakpoints: fEliminates surfing through source codes to find event handlers. Any event from any object on a page can be captured.
2. Mozilla Firefox DevTools
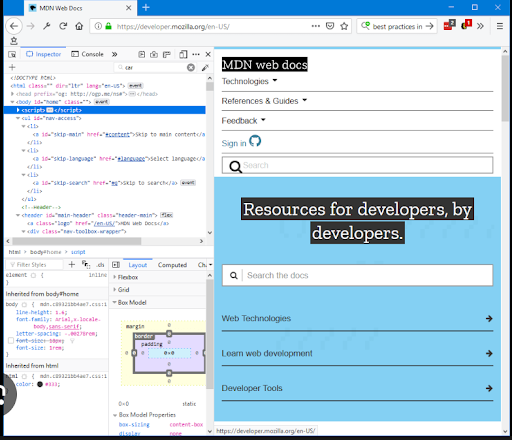
This is the robust debugging option to render smooth user experience.
Features
- Offers an intuitive interface that offers real-time editing and debugging of HTML, CSS, and JavaScript.
- It supports Web Console which is considered a powerful tool for JavaScript debugging. You can interact with the page, view console logos, run JavaScript commands, and a lot more to easily pinpoint issues in your scripts.
- The comprehensive network analysis tool is an invaluable feature that helps monitor network requests, inspect response payloads, and examine headers. This can optimize your page load time with an effective diagnosis of network-related issues.
- The built-in performance profiling tools let you identify bottlenecks in the code to speed up your web application for high efficiency.
3. Safari Inspector

This is the apple specific tool for frontend developer
Features
- Safari Web Inspector facilitates real-time editing and debugging. You can easily make changes to your code with this tool and immediately witness the results in real time.
- The timeline and memory profiling feature of this tool helps developers identify the loopholes in the web application. As a result, it offers insights into resource usage and execution timelines.
- By providing a responsive design mode developers can test and preview web pages on distinct devices and screen sizes. This is essential to ensure cross-platform compatibility and responsiveness of your website across different platforms.
4. Angular Augury

Only for the Angular developer for debugging purpose.
Features
- Component Tree: Depicts the loaded components that belong to the application along with the hierarchical relationship between them.
- Change Detection: Displays whether this functionality is used in the components or not.
- Object Properties and Dependencies: Lists the properties and dependencies of the components.
- Router Tree: Depicts the routing information for the application.
- Source Code: Helps to show the TypeScript code instead of the compiled JavaScript code.
5. WebStorm by JET Brain

Targeted for the JavaScript developer, WebStorm is the perfect match large development projects.
Features
- Includes built-in tools for critical tasks such as debugging, testing and tracing applications, including both Node.js and client-facing apps.
- The front-end developer tool is easy to integrate with popular command-line tools that accelerate web development.
- JavaScript codes can be easily traced with an in-built tool known as Spy-js.
- Enables developers to work with multiple popular Version Control Systems via a unified user interface.
- Both coding and debugging can be customised for both Node.js and client-facing apps.
6. NodeJS Inspector

This is the wonderful tool mainly used for Node.js applications.
Features
- Ability to seamlessly navigate through source files.
- Developers can set breakpoints and specific the respective trigger conditions.
- The debugging process includes functions such as inspecting scopes, variables, and object properties.
- Includes CPU and HEAP profiling along with network client requests inspections.
7. JS Bin

The collaborative debugging front-end developer tool that is aimed at assisting Javascript developers. Developers can test and debug scripts in tandem with their team members through the debug console.
Features
- CodeCasting, where coding sessions can be recorded and cast out in real-time to various participants.
- Live code reloads in both the available views – editor and full preview.
- Processors including HTML, Markdown, Jade, CSS, JavaScript, Coffeescript, TypeScript, and LiveScript.
- Linting with complete configuration control. This includes JSHint, CoffeeLint, CSSLint, and HTMLLint.
